Ryukoku University You, Unlimited
Need Help?
About
Facts & Figures
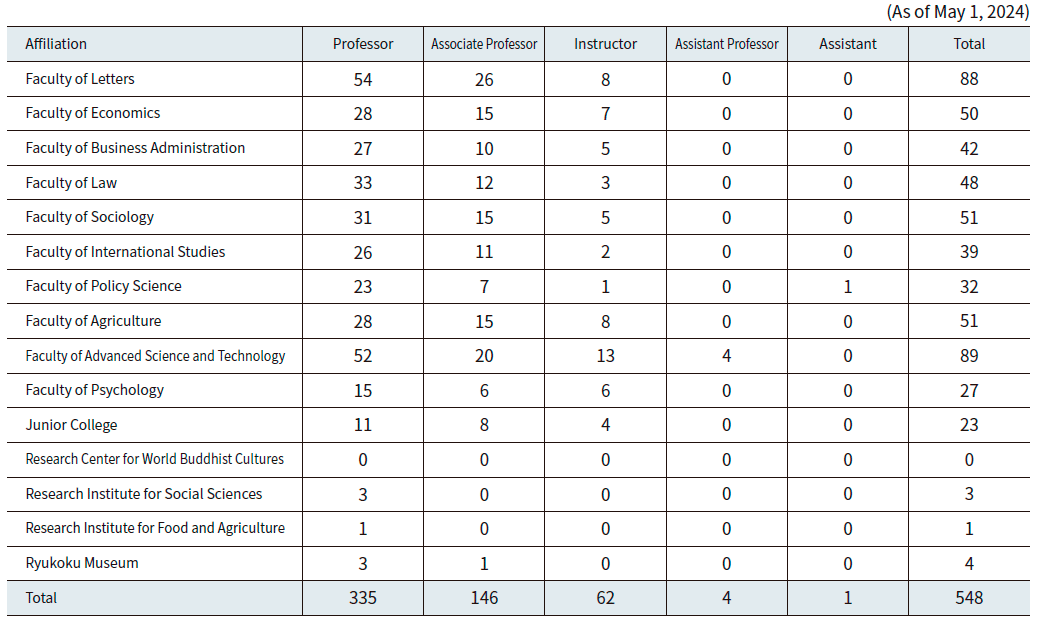
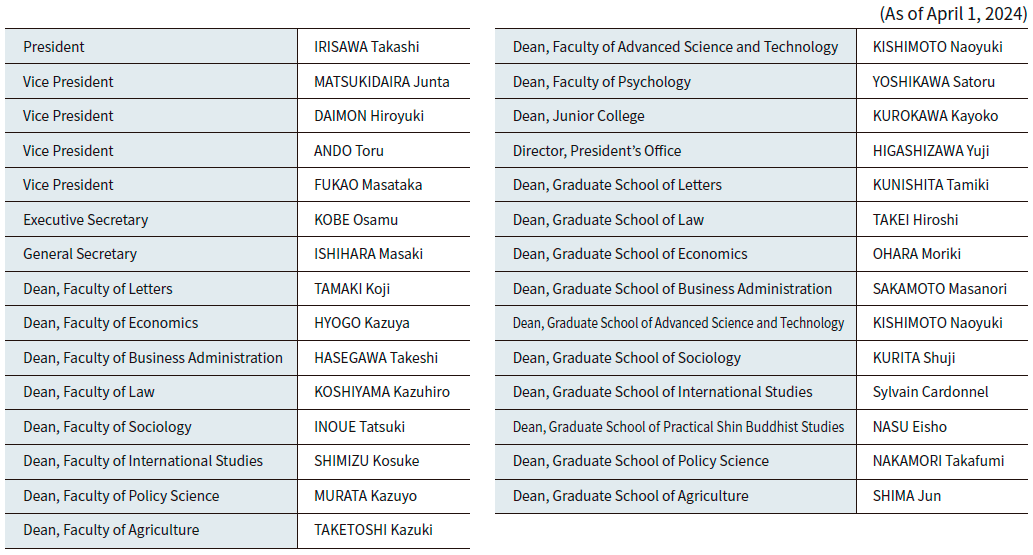
Faculty(by Position)
Ryukoku University Executive Officers and Councillors
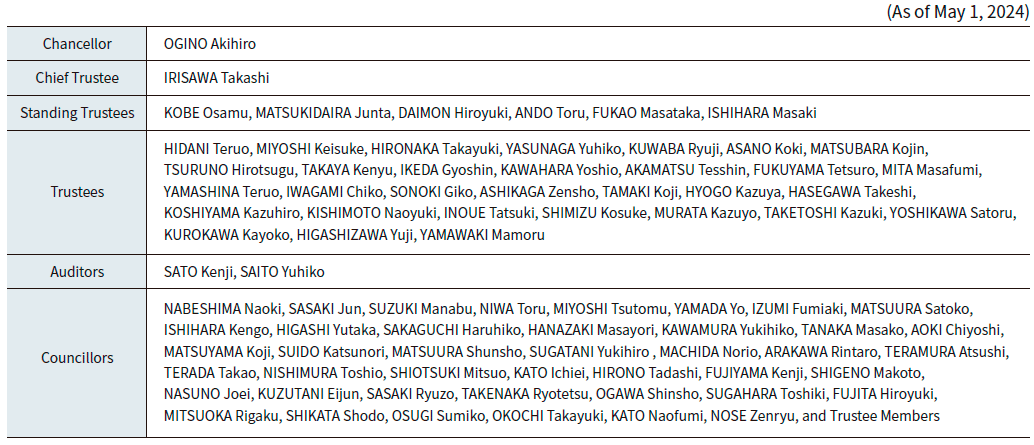
Ryukoku University Officers
Ground Area and Building Floor Space

Library Collections

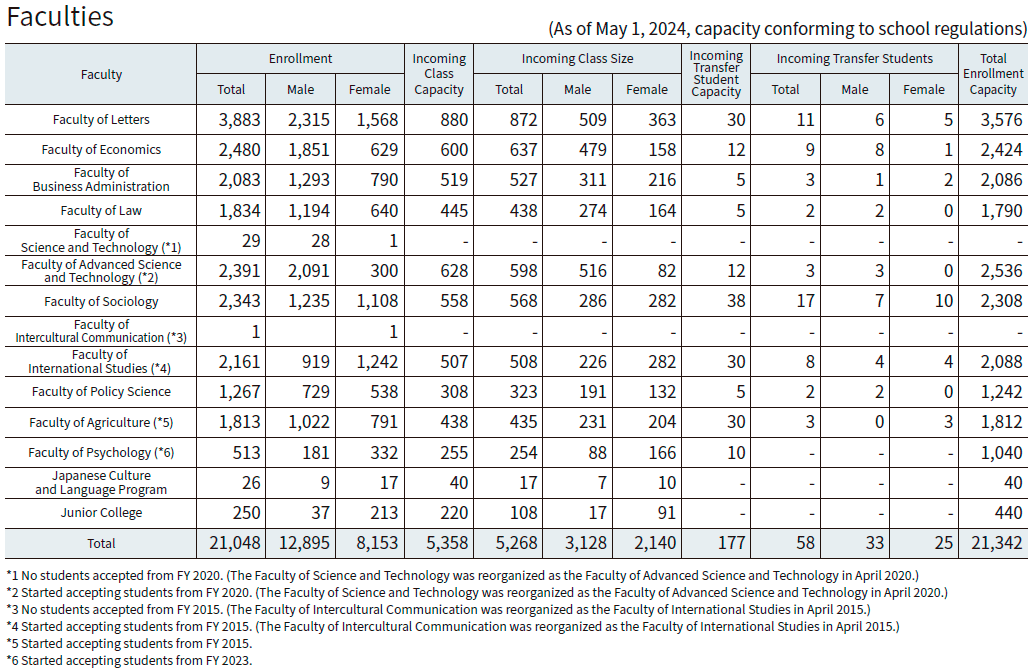
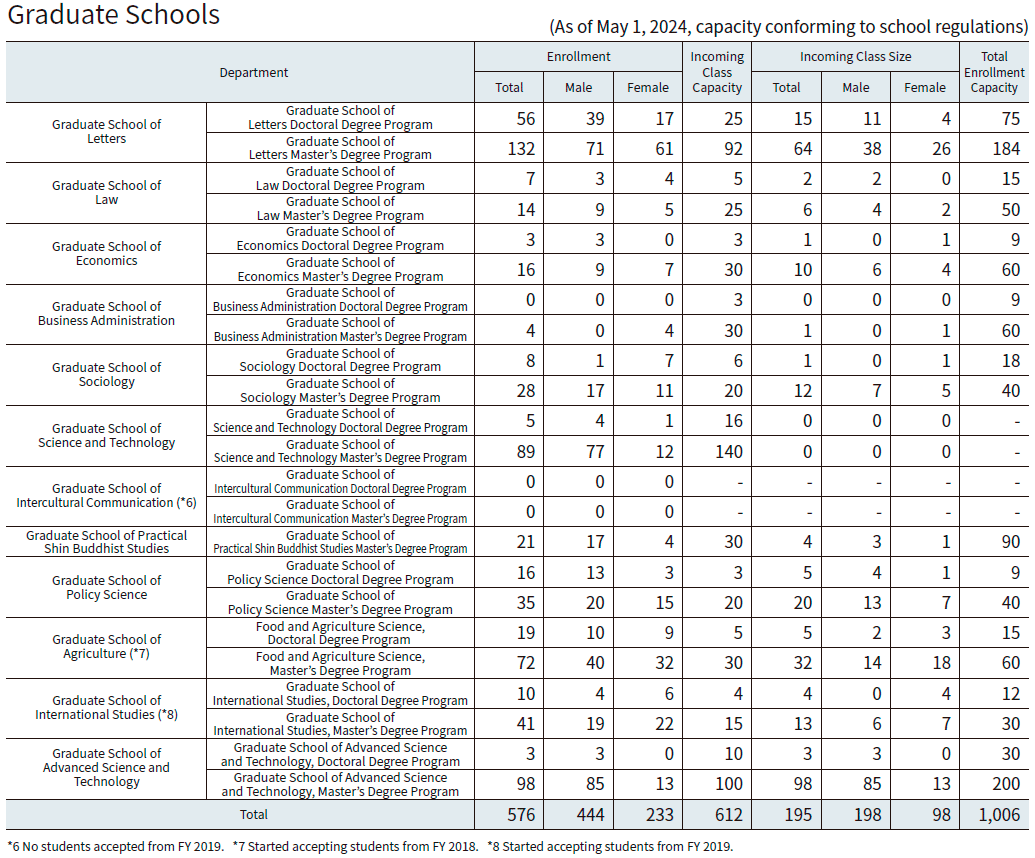
Enrollment, Incoming Class Capacity,
Incoming Class Size, Total Enrollment Capacity
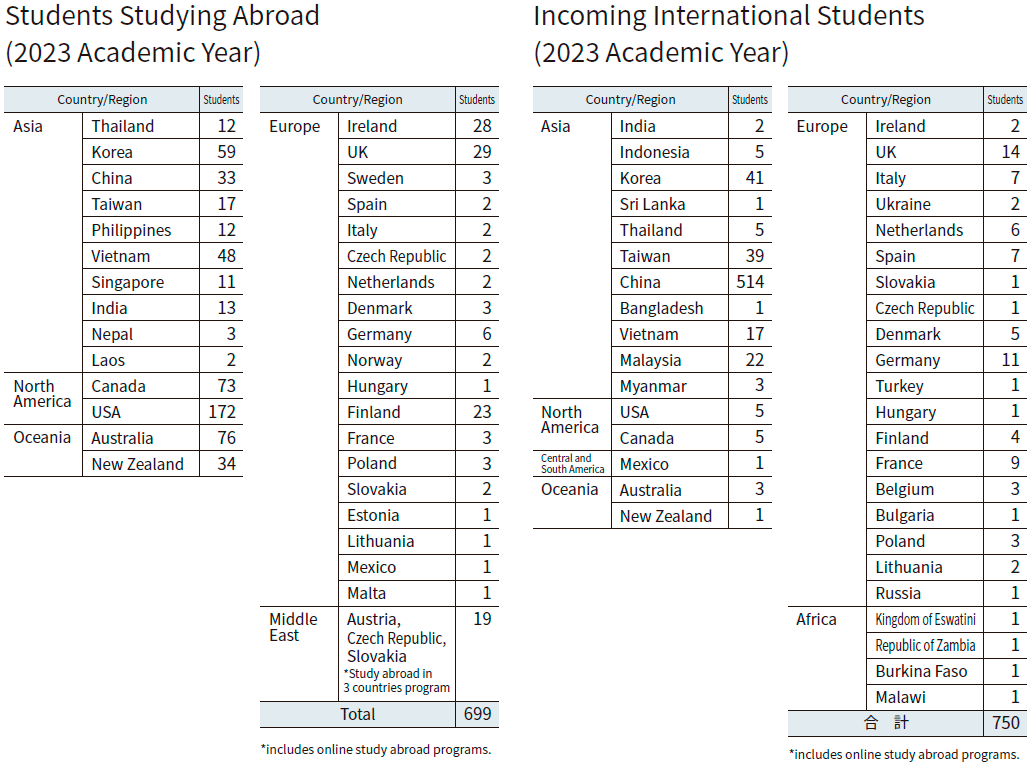
Study Abroad
Further Educational Advancement
and Job Placement Status
■Further Educational Advancement and Job Placement Rate(2024 Academic Year)
(As of May 1, 2025)
Undergraduate
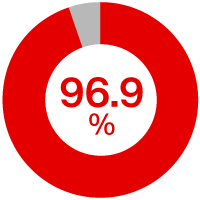
*2024 Academic Year
Students Receiving Job Offers: 3,958
Students Continuing to Graduate School: 279
Junior College
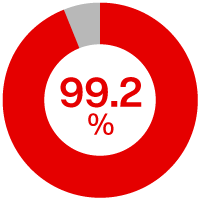
*2024 Academic Year
Students receiving Job Offers: 73
Students Continuing (Transferring) to University: 47
■Job Placement by Industry(2024 Academic Year)
(As of May 1, 2025)
Humanities-related Faculties

Faculty of Advanced Science and Technology

Faculty of Agriculture

Junior College


- Faculty of Psychology
- Faculty of Letters
- Faculty of Economics
- Faculty of Business Administration
- Faculty of Law
- Faculty of Policy Science
- Faculty of International Studies
- Faculty of Advanced Science and Technology
- Faculty of Sociology
- Faculty of Agriculture
- Junior College
■Faculty of Psychology (Open in April 2023)
2024 Academic Year(Selected Achievements of Graduating Students)
- Murata Manufacturing Co., Ltd.
- West Japan Railway Company
- KATOJI Co., Ltd.
- McDonald's Company (Japan), Ltd.
- Japan Post Bank Co., Ltd.
- Mynavi Corporation
- Keihan Hotels & Resorts Co., Ltd.
- Osaka Social Welfare Corporation
- Ministry of Health, Labour and Welfare
- Kyoto City Government
■Faculty of Letters
2024 Academic Year(Selected Achievements of Graduating Students)
- Ichijo Co., Ltd.
- Takara Standard Co., Ltd.
- The Kansai Electric Power Co., Inc.
- Nippon Access, Inc.
- Nitori Co., Ltd.
- The Kyoto Chuo Shinkin Bank
- FUJISOFT INCORPORATED
- JTB Corp.
- Japan Pension Service
- Kyoto City Board of Education
- Ministry of Finance
■Faculty of Economics
2024 Academic Year(Selected Achievements of Graduating Students)
- Panasonic Homes Co., Ltd.
- FUJIFILM Business Innovation Corp.
- Nidec Corporation
- ROHM Co., Ltd.
- Zensho Holdings Co., Ltd.
- FAST RETAILING CO., LTD.
- OKASAN SECURITIES CO., LTD.
- Mitsubishi UFJ Morgan Stanley Securities Co., Ltd.
- Funai Soken Co., Ltd.
- National Tax Agency
■Faculty of Business Administration
2024 Academic Year(Selected Achievements of Graduating Students)
- Sumitomo Forestry Co., Ltd.
- Nippon Electric Glass Co., Ltd.
- Nitori Co., Ltd.
- Kansai Mirai Bank, Limited
- Tokai Tokyo Financial Holdings, Inc.
- NTT DATA Group Corporation
- Fujitsu Limited
- Suntory Holdings Limited
- Japan Coast Guard
- Shiga Prefectural Government
■Faculty of Law
2024 Academic Year(Selected Achievements of Graduating Students)
- Gekkeikan Sake Co., Ltd.
- NEC Corporation
- The Kansai Electric Power Co., Inc.
- Nippon Express Co., Ltd.
- Meiji Yasuda Life Insurance Company
- SoftBank Group Corp.
- Ministry of Finance
- Ministry of Justice
- Nara Prefectural Police
- Kyoto Prefectural Police
■Faculty of Policy Science
2024 Academic Year(Selected Achievements of Graduating Students)
- The Kansai Electric Power Company,Incorporated
- Chuo Warehouse Co.,Ltd.
- SHARP MARKETING JAPAN CORPORATION
- AOYAMA TRADING Co., Ltd.
- Kansai Mirai Bank, Limited
- Kansai Mirai Bank, Limited
- FUJI SOFT INCORPORATED
- Hoshino Resorts Inc.
- Japanese Red Cross Society
- Japan Pension Service
- Benesse Style Care Co.,Ltd.
- Ministry of Land, Infrastructure, Transport and Tourism
■Faculty of International Studies
2024 Academic Year(Selected Achievements of Graduating Students)
- YKK AP Inc.
- Jetstar Japan Co., Ltd.
- Japan Airlines Co., Ltd.
- AGC Glass Building Materials Co., Ltd.
- AEON RETAIL Co., Ltd.
- The Dai-ichi Life Insurance Company, Limited
- FUJISOFT INCORPORATED
- The Ritz-Carlton, Osaka
- H.I.S. Co., Ltd.
- Tobu Top Tours Co., Ltd.
■Faculty of Advanced Science and Technology
2024 Academic Year(Selected Achievements of Graduating Students)
- Kinden Corporation
- Mitsubishi Heavy Industries, Ltd.
- Yamaha Motor Co., Ltd.
- OMRON Corporation
- Kyocera Corporation
- Nidec Corporation
- ROHM Co., Ltd.
- Hitachi Solutions, Ltd.
- Fujitsu Limited
- NTT DOCOMO, INC.
■Faculty of Sociology
2024 Academic Year(Selected Achievements of Graduating Students)
- ITO EN, Ltd.
- Nichirei Corporation
- Panasonic Corporation
- The Shiga Bank, Ltd.
- Sompo Japan Insurance Inc.
- FUJIFILM Business Innovation Japan Corp.
- Japan Organization for Employment of the Elderly, Persons with Disabilities and Job Seekers.
- Saiseikai Shigaken Hospital
- Kyoto Prefectural Board of Education
- Osaka Prefectural Government
■Faculty of Agriculture
2024 Academic Year(Selected Achievements of Graduating Students)
- Ajinomoto Frozen Foods Co., Inc.
- Tamanoi Vinegar Co., Ltd.
- Yamazaki Baking Co., Ltd.
- Takii & Co., Ltd.
- Yanmar Agri Japan Co., Ltd.
- Ito Ham Yonekyu Foods Inc.
- Japanese Red Cross Kyoto Daiichi Hospital
- Taneya Co., Ltd.
- Japanese Red Cross Kyoto Daiichi Hospital
- Ministry of Agriculture, Forestry and Fisheries
■Junior College
2024 Academic Year(Selected Achievements of Graduating Students)
- Akanae Kindergarten
- Amanogawa Nursery School
- Kamogawa Kindergarten
- Hanazono Nursery School
- Midori Nursery School
- Shimizudai Kindergarten
- Shiga Prefectural Government
- KANSAI UNIVERSITY (university enrolment)
- Kyoto Sangyo University (university enrolment)
- Ryukoku University (university enrolment)
■Graduate
Job Placement Rate(As of May 1, 2022)
| Company Employee, etc |
Public Employee |
Postgraduate Studies, etc |
Other | |
|---|---|---|---|---|
| Graduate School of Letters | ||||
| Master's Degree Program | 47.9% | 12.5% | 18.8% | 20.8% |
| Doctor's Degree Program | 0.0% | 0.0% | 0.0% | 0.0% |
| Graduate School of Law | ||||
| Master's Degree Program | 57.1% | 14.3% | 14.3% | 14.3% |
| Doctor's Degree Program | 0.0% | 0.0% | 0.0% | 100.0% |
| Graduate School of Economics | ||||
| Master's Degree Program | 40.0% | 0.0% | 0.0% | 60.0% |
| Doctor's Degree Program | 100.0% | 0.0% | 0.0% | 0.0% |
| Graduate School of Business Administration | ||||
| Master's Degree Program | 20.0% | 0.0% | 0.0% | 80.0% |
| Doctor's Degree Program | 0.0% | 0.0% | 0.0% | 0.0% |
| Graduate School of Sociology | ||||
| Master's Degree Program | 44.4% | 0.0% | 22.2% | 33.3% |
| Doctor's Degree Program | 0.0% | 0.0% | 0.0% | 0.0% |
| Graduate School of Science and Technology | ||||
| Master's Degree Program | 87.3% | 1.8% | 1.8% | 9.1% |
| Doctor's Degree Program | 0.0% | 0.0% | 0.0% | 0.0% |
| Graduate School of Practical Shin Buddhist Studies | ||||
| Master's Degree Program | 55.6% | 0.0% | 22.2% | 22.2% |
| Graduate School of Policy Science | ||||
| Master's Degree Program | 50.0% | 33.3% | 5.6% | 11.1% |
| Doctor's Degree Program | 0.0% | 0.0% | 0.0% | 100.0% |
| Graduate School of Agriculture | ||||
| Master's Degree Program | 85.0% | 0.0% | 10.0% | 5.0% |
| Doctor's Degree Program | 100.0% | 0.0% | 0.0% | 0.0% |
| Graduate School of International Studies | ||||
| Master's Degree Program | 36.4% | 0.0% | 18.2% | 45.5% |
| Doctor's Degree Program | 0.0% | 0.0% | 0.0% | 0.0% |
